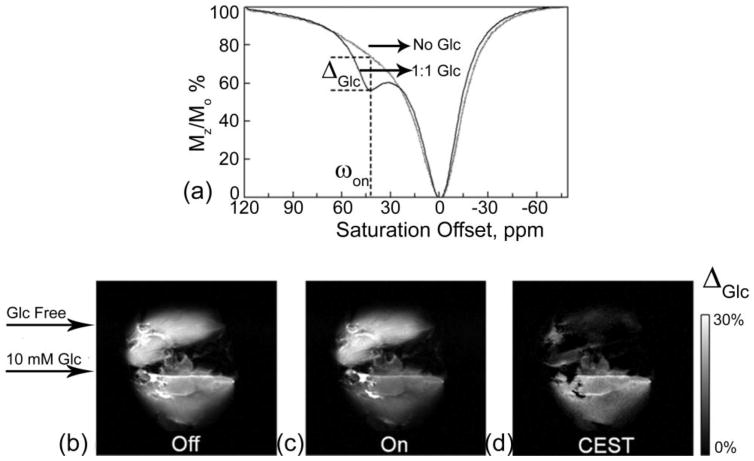
Figure 34.
(a) CEST spectra of fresh effluent from a perfused fed-mouse liver (1:1 Glc) and a 24-hr fasted mouse liver (No Glc) at 310 K showing a glucose-induced CEST peak at on 42 ppm. Both perfusates contained 10 mM Eu3+-58 agent, pH 7.4. Off-resonance (b) and on-resonance (c) CEST images of a fed mouse liver (bottom, 10 mM Glc) and a 24-hr fasted mouse liver (top, Glc free) perfused with 10 mM Eu3+-58 agent in the presence (fed liver) and absence (fasted liver) of 10 mM glucose, 310 K. The “off -resonance” image (b) showed no contrast between the two livers while the “on-resonance” image (c) showed image darkening of fed liver versus the fasted mouse liver with on 42 ppm. (d) The CEST difference image showed the glucose induced CEST contrast between the fed and fasted mouse livers. CEST MR imaging conditions: irradiation time = 2 s and irradiation frequency = 23.5 μT. Reference 197. Copyright (2008); Reprinted with permission of John Wiley & Sons, Inc.197

