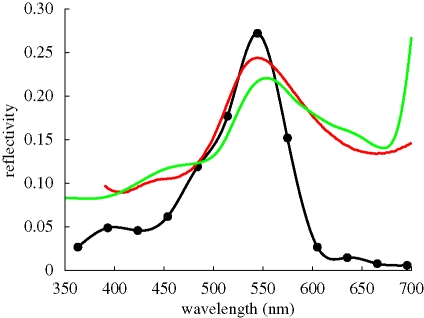
Figure 2.
Reflectivity spectrum measured with a microspectrophotometer of a single scale of the ventral wing of C. rubi (red line) and of an oak leaf (green line). Filled circles (solid black line): FDTD simulation result for the average of the reflectivities of 14 differently oriented gyroid structures exposed to normally incident light with transverse magnetic (TM) and transverse electric (TE) polarization (figure 3).

