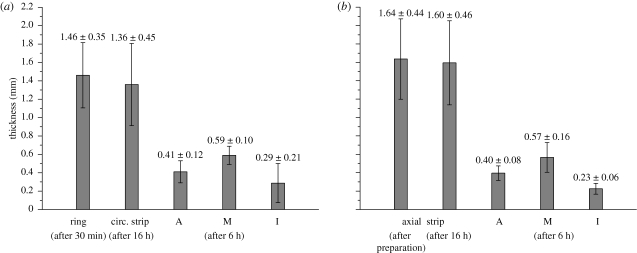
Figure 2.
Column plots (mean values and s.d.) of aortic wall thicknesses and of the separated layer thicknesses (A, adventitia; M, media; I, intima) from (a) the circumferential and (b) the axial directions. The error bars indicate s.d. Adapted from fig. 9 of Holzapfel et al. (2007) with kind permission of Springer Science and Business Media.

