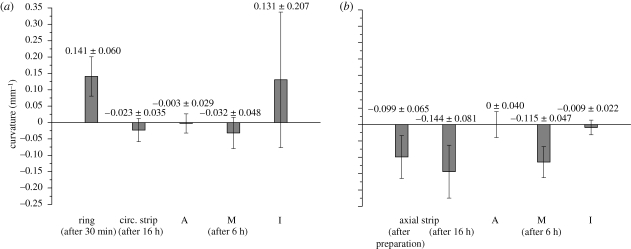
Figure 3.
Column plots (mean values and s.d.) of the curvature of the aortic ring, the circumferential strips and the separated layers (A, adventitia; M, media; I, intima) oriented in the (a) circumferential direction; the axial strip and the separated layers (A, M, I) oriented in the (b) axial direction. The error bars represent s.d. Adapted from fig. 12 of Holzapfel et al. (2007) with kind permission of Springer Science and Business Media.

