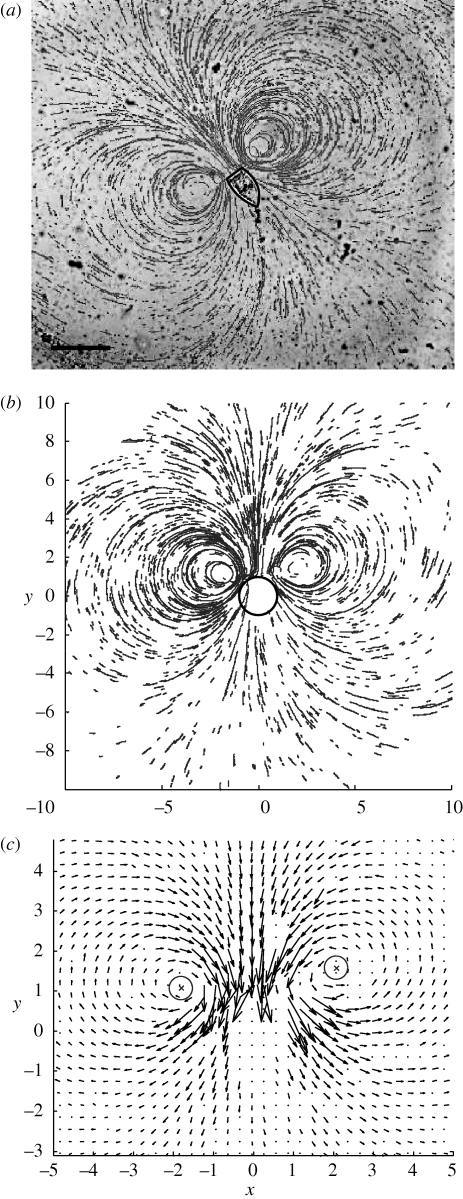
Figure 5.
An example of the analysis of experimental data. (a) One frame from a high-speed movie showing a V. convallaria in the centre overlayed with particle tracks. The Vorticella body is outlined in a thick solid line. Scale bar, 100 µm. (b) The particle tracks from (a) rotated and scaled by the radius of the Vorticella. The circles show the position and radius of the Vorticella. (c) The flow field calculated by PTV. Velocities are scaled such that they will not intersect, and then lengthened by a further factor of four. The three largest velocity vectors have been removed for ease of viewing. X-marks surrounded by circles (grey) show the centre of the eddies with the outer circle representing the positional error. For this example, h = 127 ± 28 µm.

