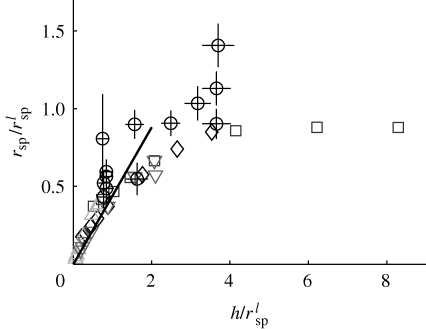
Figure 7.
Plot of rsp/rspl versus h/rspl for simulations (shapes) and experiments (circles), where rspl is the predicted distance to the eddy centre for large h as described in the text. The solid line is the prediction rsp = 0.44 h from the stokeslet model. In experiments, ℓst was measured from the anchoring tip of the Vorticella stalk to the middle of the crown. In simulations, both h, the distance between top and bottom boundaries, and ℓst, the distance to the third no-slip boundary, were varied. Squares: h/a = 2.5–40, ℓst/a = 3; diamonds: h/a = 2.5–40, ℓst/a = 10; upward triangles: h/a = 3, ℓst/a = 1.5–50; downward triangles: h/a = 10, ℓst/a = 1.5–50.

