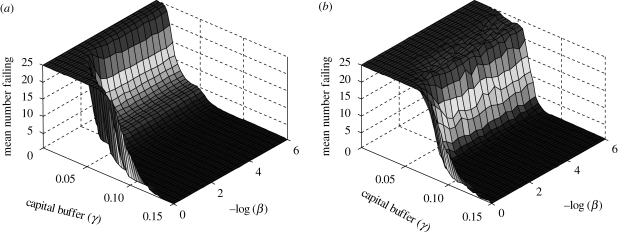
Figure 11.
Mean number of banks failing as a function of γ and the WLS parameter β. (a) The case where WLS remain weak throughout successive bank collapses. This contrasts with figures 7–10, where WLS become ‘strong’ where they cause bank collapse (z = 4.8, WLS → WLS). (b) The case where WLS become ‘strong’ where they cause a bank collapse (z = 4.8, WLS → SLS). This is the same process as in figures 7–10.

