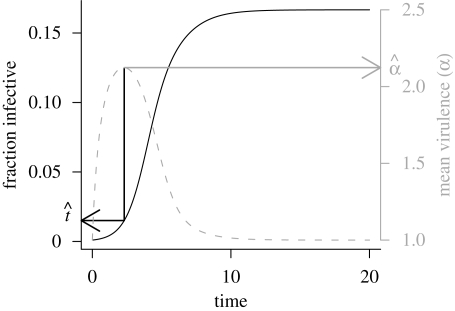
Figure 1.
Basic epidemic–evolutionary dynamics of an emerging pathogen. Black line (left axis) shows the fraction of the host population infective (prevalence) over time; grey line (right axis) shows the average virulence of the pathogen population over time. Black arrow shows the peak time t̂, expressed as a prevalence (see main text); grey arrow shows the peak virulence α̂, relative to the equilibrium virulence. Parameters: Vg = 5, c = 3, γ = 2 (R*0 = 1.5, α* = 1); starting conditions I(0) = 0.001, S(0) = 0.999, α(0) = α* = 1.

