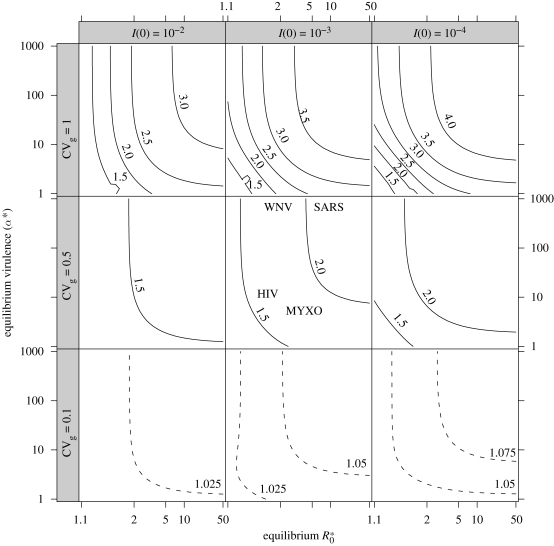
Figure 2.
Peak virulence α̂, scaled by equilibrium virulence, across a range of parameters. Axes within subfigures: equilibrium R*0 (horizontal), equilibrium virulence α* (vertical). Subfigures: starting prevalence I(0) (horizontal), genetic coefficient of variation in virulence CVg (vertical). Solid contours range from 1.5 to 4 in steps of 0.5; dashed contours (shown only in bottom row, for CVg = 0.1) range from 1 to 1.5 in steps of 0.025. Middle figure shows the location of emerging pathogens from table 1 with respect to R*0 and α* (genetic variability and initial prevalence are unknown for these pathogens). (Horizontal positions of WNV and SARS are displaced slightly for legibility.)

