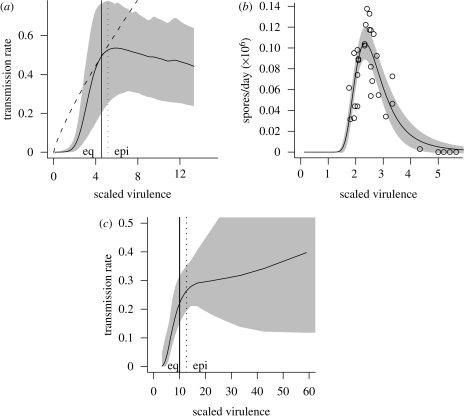
Figure 4.
Tradeoff curves: shaded areas show 95% confidence envelopes in all cases. (a) Myxomatosis in European rabbits (Dwyer et al. 1990). Solid curve, estimated tradeoff curve; dashed curve, tradeoff curve based on equation (2.3) with equivalent equilibrium virulence α*. Vertical lines show (solid) equilibrium virulence and (dotted) optimal epidemic virulence for the more realistic tradeoff curve. (b) Pasteuria ramosa in Daphnia magna (Jensen et al. 2006): fit of a quadratic generalized linear model. (c) HIV in humans (Fraser et al. 2007).

