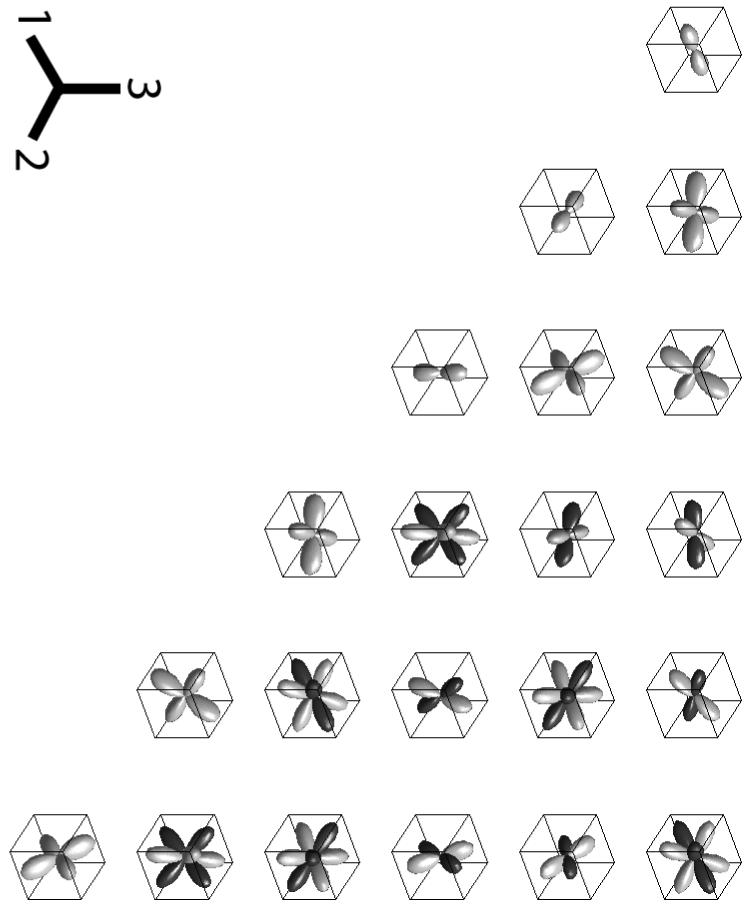
Figure 6.

Polar plots of the components of KIJ(n), the 6×6 matrix representation of K. The plot in the Ith row and Jth column is the polar plot of KIJ(n). Positive values are represented in gray, negative values are represented in black. The magnitude of KIJ in the direction n indicates the degree to which filaments oriented in the direction n contribute to elastic modulus CIJ. For example, K11 is largest in the e1 direction, indicating that filaments oriented in this direction contribute the most to C11. Note that for clarity, the components were not all plotted on the same scale.
