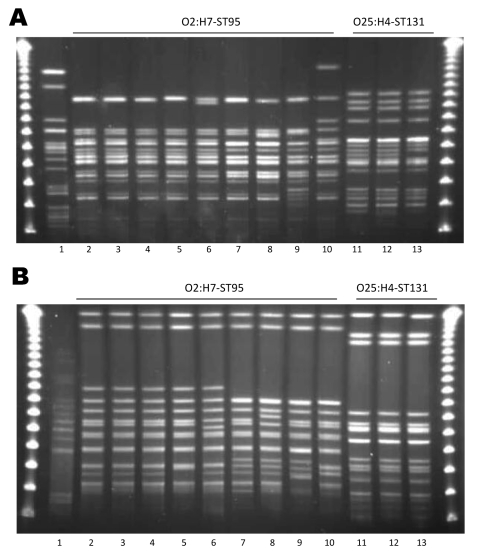
Figure 1.
Pulsed-field gel electrophoresis patterns for Escherichia coli O2:H7-ST95 and E. coli O25:H4-ST131. A) XbaI; B) NotI. Lane 1 is the positive control E. coli O11:H18-ST69 (SEQ102); lane 2 is an E. coli O2:H7-ST95 isolate from a restaurant sample of honeydew melon (68616.01); lanes 3–10 are isolates from human urinary tract infection cases (UTIs; lane 3, MSHS 100; lane 4, MSHS 186; lane 5, MSHS 811; lane 6, MSHS 1229; lane 7, MSHS 95; lane 8, MSHS 1062; lane 9, MSHS 782; lane 10, MSHS 819); lane 11 is an E. coli O25:H4-ST131 isolate from a retail chicken sample (EC01DT06-1737-01); and lanes 12 and 13 are E. coli isolates from human UTIs (lane 12, MSHS 161; lane 13, MSHS 1134A). Outer lanes are pulsed-field molecular weight markers.

