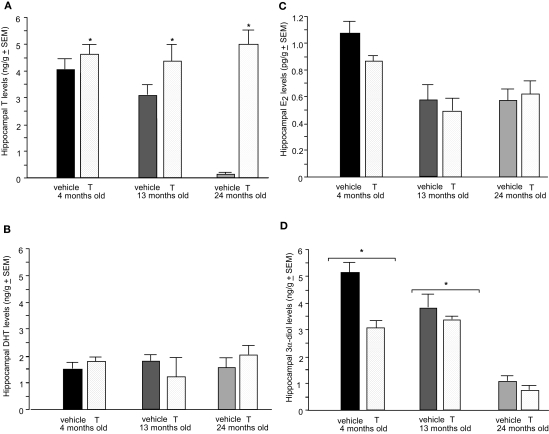
Figure 4.
Represents hippocampal levels of T (A), E2 (B), DHT (C), and 3α-diol (D) in – (black bars), 13- (dark grey bars), and 24- (light grey bars) month-old intact rats administered subcutaneous injections of sesame oil vehicle (solid bars) or T (stippled bars). * Over individual bars denotes significant difference (p < 0.05) of T-administration over vehicle (p < 0.05). * Over brackets denotes difference at that age group compared to age groups that do not have bracket above bars (p < 0.05).

