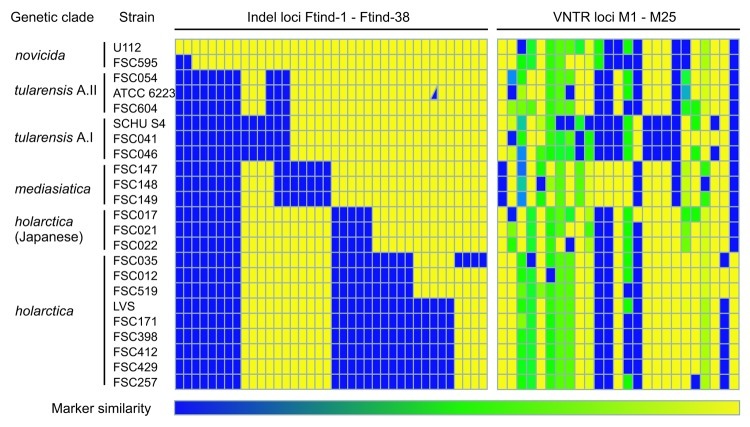
Figure 3.
Heat map of marker states for 38 insertion-deletion (indel) and 25 multilocus variable-number tandem repeat analysis (MLVA) loci examined. Each Francisella tularensis strain is represented by a single row of colored boxes and each DNA loci by a single column. Relative genetic similarity is represented by the similarity of the colors on the gradient scale ranging from blue to yellow. For the binary indel markers, the state of each marker in the genome of strain F. tularensis subsp. novicida U112 represents the index and is depicted in yellow. Blue indicates the amplification of an allelic variant distinct from that of the index genome. For strain ATCC 6223, both alleles were amplified at loci Ftind-32, and the corresponding box is thus divided into a yellow and a blue part. For MLVA loci, blue represents the largest allele size for each multistate marker; yellow represents the smallest.

