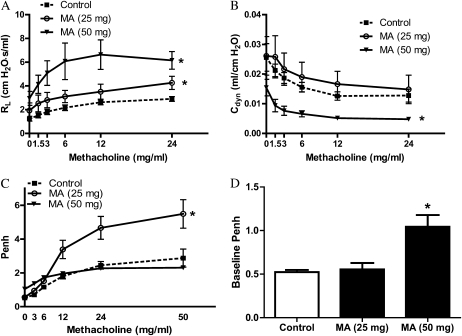
Figure 1.
Pulmonary function 3 hours after exposure to methamphetamine (MA) vapor. Pulmonary function was assessed as a function of increasing methacholine dose in live mice 3 hours after exposure to MA. (A and B) Transpulmonary resistance (RL [A]) and dynamic compliance (Cdyn [B]) were assessed after anesthetization and tracheostomy (n = 10 for control; n = 5 for 25 mg MA; and n = 6 for 50 mg MA). Statistical analysis by two-factor ANOVA shows significant effects for 25- and 50-mg concentrations (RL), and 50 mg MA (Cdyn) compared with control animals. *P < 0.05. (C and D) Barometric whole-body plethysmography (WBP) was assessed in spontaneously breathing mice (n = 4 [C]). For the 25-mg dose, statistical analysis by two-factor ANOVA shows significant effects for MA treatment compared with control animals (*P < 0.05). Baseline enhanced pause (Penh) is shown in D (n = 4). Baseline Penh is expressed as means (±SE). *P < 0.05 versus control animals.

