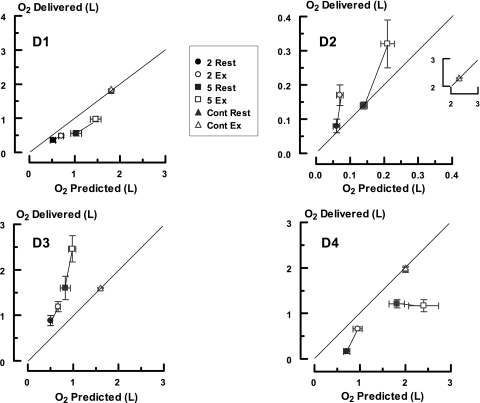
Figure 4.
Comparison of the predicted and delivered quantities of O2 provided by each conserver. The abscissa displays the predicted values derived from ex vivo testing and the ordinate the amounts actually provided during in vivo use. The data points are mean values and the brackets 1 SEM. The solid lines are the lines of identity. The solid symbols indicate data obtained at rest; open symbols depict exercise. The prefixes 2, 5, and cont refer to the 2, 5, and continuous regulator settings studied. The notations D1, D2, D3, and D4 indicate the various conservers. The insert in the D2 graph presents the findings with the continuous setting.

