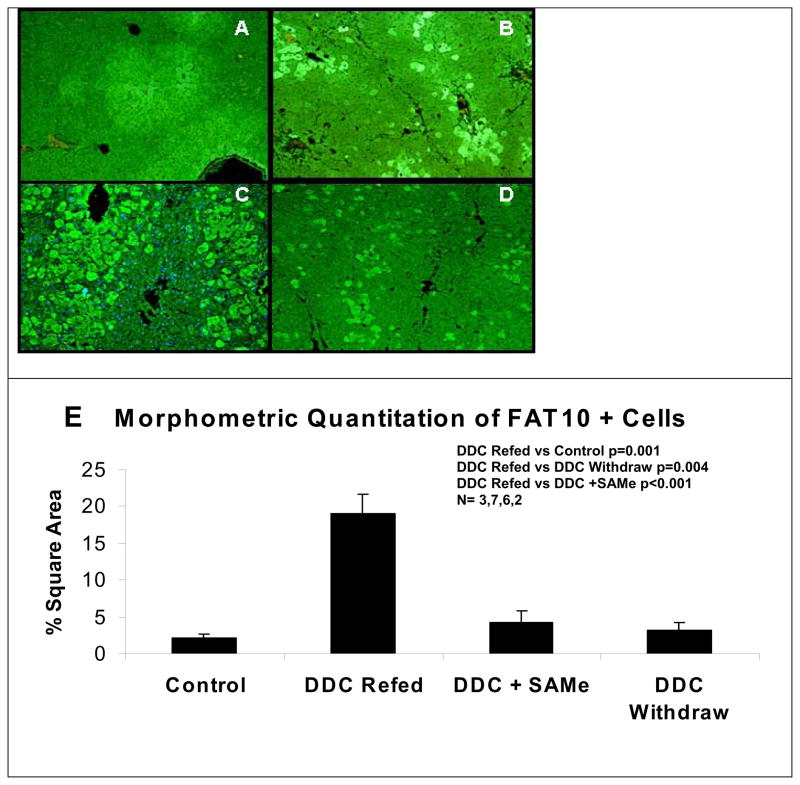
Fig 3.
Expression of UBD and UB in the tissue sections. A) FAT10 positives hepatocytes lightly marked x200. B) Fat10 forming hepatocytes persist in the liver after one month withdrawal of DDC x200. C) Fat10 positive hepatocytes markedly increased in number in DDC/Refed Mice x200. D) Fat10 positive hepatocytes did not increase in DDC Refed mice when SAMe was added to the diet x200. E) Quantitation of the number of FAT10 positive liver cells as determinated by using morphometric analysis. (N=3,7,6,2)

