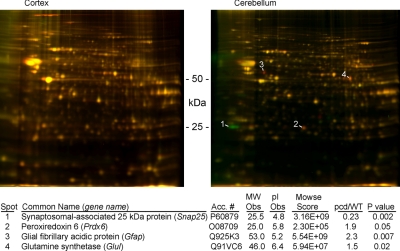
Figure 4.
Proteomics analysis of adult WT and pcd mouse brain, analyzed using 2-D-differential in-gel electrophoresis (2D-DIGE). Brain regions from WT mice were labeled with Cy3 (green); cortex and cerebellum from pcd mice were labeled with Cy5 (red). Replicate samples from additional mice were labeled with reverse orientation of dyes. Left panel: cortex. No changes in spot intensity between WT and pcd cortex were detected; all spots appear yellow. Right panel: cerebellum. Several spots were higher in the WT samples than the pcd samples (green); other spots were higher in the pcd samples (red). Spots confirmed to change in a total of 5 replicate gels from distinct animals are numbered. Bottom: cerebellar proteins that changed consistently were identified by mass spectrometry. MW Obs, observed molecular weight; pI Obs, observed isoelectric point; pcd/WT, spot volume ratio for the pcd sample vs. the WT sample (n=5). Difference in spot volume between the two samples was found to be statistically significant using Student’s t test; P values are indicated.

