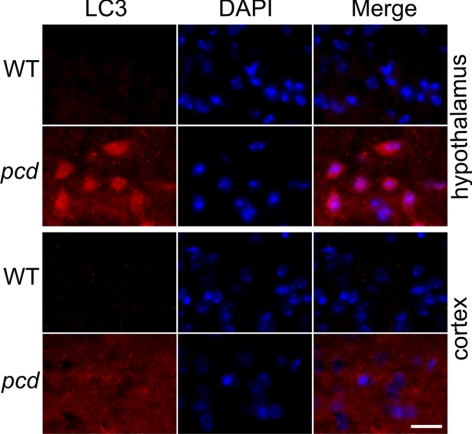
Figure 6.
Distribution of LC3 in 22-wk-old WT and pcd hypothalamus and cortex. Two top panels show WT and pcd hypothalamic sections; two bottom panels show sections of WT and pcd cortex. Tissues were probed with an antibody against LC3 (marker for autophagosome) and with DAPI (marker for cell nuclei). LC3 shows more intense and punctate staining in the hypothalamus and cortex of pcd mice. Comparable results were seen with 7-wk-old WT and pcd mice (data not shown). Scale bar = 10 μm.

