Figure 7.
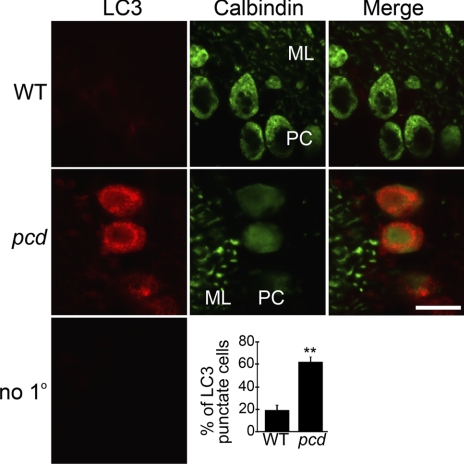
Distribution of LC3 in Purkinje cells of 3-wk-old WT and pcd cerebellum. Top and middle panels show WT and pcd cerebellar sections, respectively, both subjected to immunostaining with antibodies against LC3 (a marker for autophagosome) and calbindin (a marker for Purkinje cells). Molecular layer (ML) shows Purkinje cell dendrites (green); Purkinje cell layer (PC) shows Purkinje cell bodies (green). LC3 (red) shows a diffuse distribution in Purkinje cells of WT mice. In pcd Purkinje cells, LC3 shows strong staining with a punctate distribution in the cell bodies. Bottom panel shows cerebellar section probed with secondary antibodies only (negative control). Percentage of LC3 punctate cells in cerebellum of WT and pcd mice was determined by an observer who was masked to the genotype. At least 40 calbindin-positive cells were counted in each cerebellar section; several sections were analyzed for each mouse; 3 mice/group. **P < 0.01; Student’s t test. Scale bar = 10 μm.

