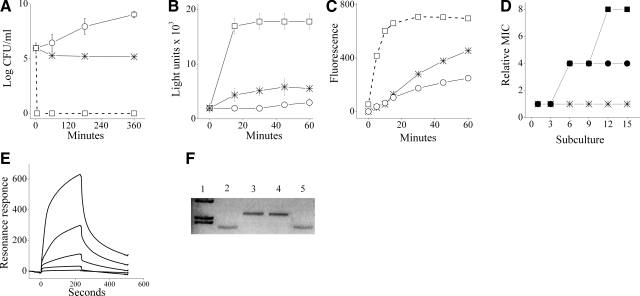
Figure 2.
Mechanistic studies. A) Viability of a representative strain (S. aureus ATCC 29213 in LB) on treatment with 4×MIC of C12(ω7)K-β12 (asterisks) or dermaseptin S4(1–16) (rectangles) and untreated control (circles). B) Extracellular ATP levels in treated S. aureus suspension, with C12(ω7)K-β12 or dermaseptin (4×MIC each). Symbols are as in panel A. C) Mean EtBr accumulation in S. aureus suspended in PBS in the absence and presence of OAK at 4×MIC (2 independent experiments, P<0.05). Asterisks, OAK; asterisk; circles, EtBr alone (untreated control); rectangles, 0.01% Triton X100 (positive control). D) MIC evolution after successive exposures of S. aureus to subinhibitory concentrations of the specified antibacterial agent: oxacillin (circles), ciprofloxacin (rectangles), and C12(ω7)K-β12 (asterisks). Relative MIC is the normalized ratio of MIC obtained for a given subculture to the MIC obtained for first-time exposure. E) Representative binding curves for various concentrations (3.125, 6.25, 12.5, 25, and 50 μM) of C12(ω7)K-β12 in PBS using a model phospholipid membrane (POPG:PE, 1:4). Higher resonance intensities correspond to higher OAK concentrations. F) Representative agarose gel runs of bacterial plasmid pUC19 in its native state (lane 2) and after 1 h exposure to BamHI (lane 3). Lane 1: molecular weight marker (λHindIII); lanes 4 and 5: pUC19 after preincubation (30 min) with C12(ω7)K-β12 and C12K-5α8 (25 μM each), respectively, followed by exposure to BamHI.

