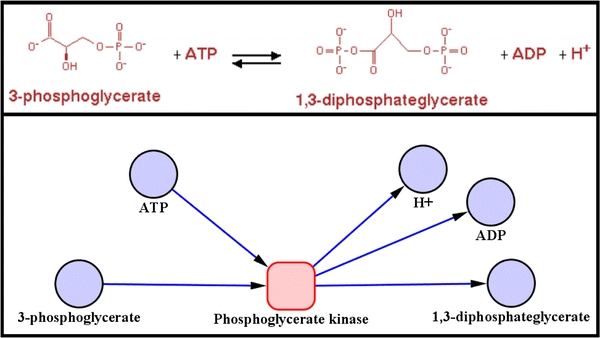
Fig. 3.

The upper panel shows a textual description of a reaction. The lower panel shows the bipartite graph modelling of this reaction. Blue nodes are metabolite and the pink node is the reaction. Arrows indicate the direction of a reaction, but in that case the reaction is reversible which is indicated by red border of the reaction node
