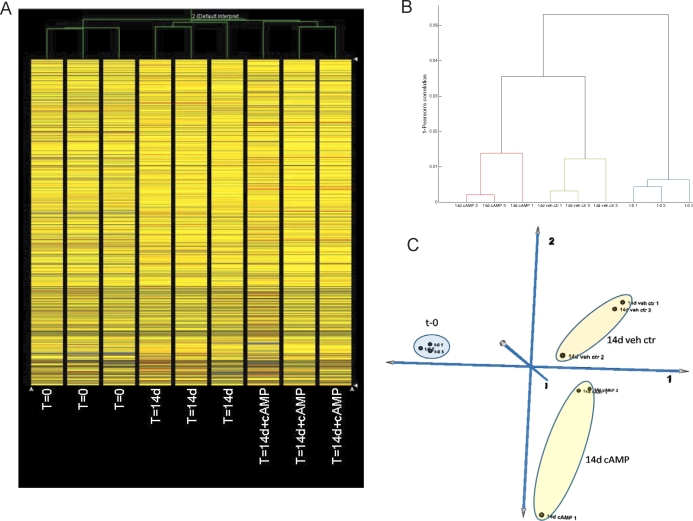
FIG. 4.
A) Hierarchical clustering analysis of MSC at t = 0 (T=0), MSC treated with vehicle for 14 days (T=14d), and MSC treated with 8-Br-cAMP for 14 days (T=14d+cAMP) are also shown. B) Dendogram of hierarchical clustering analysis of MSC at t = 0 (t-0) and 14 days after vehicle (14d veh ctr) or 8-Br-cAMP (14d cAMP) treatment. C) PCA of MSC at t = 0 and 14 days after vehicle or 8-Br-cAMP treatment.

