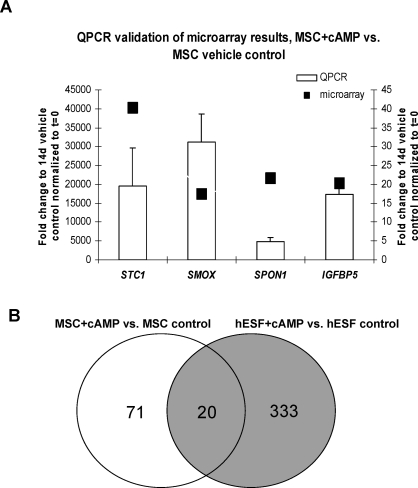
FIG. 5.
A) Real-time RT-PCR validation of selected genes in MSC treated for 14 days with cAMP versus vehicle control. Correspondent microarray data for stanniocalcin 1 (STC1), spermine oxidase (SMOX), spondin 1 (SPON1), and IGF-binding protein 5 (IGFBP5) are presented. Data are presented as fold-change. Error bars represent the SEM. The left y-axis addresses quantitative PCR results; the right y-axis addresses microarray data. B) Venn diagram of common and unique genes expressed in cAMP-treated MSC and hESF compared to their respective controls.

