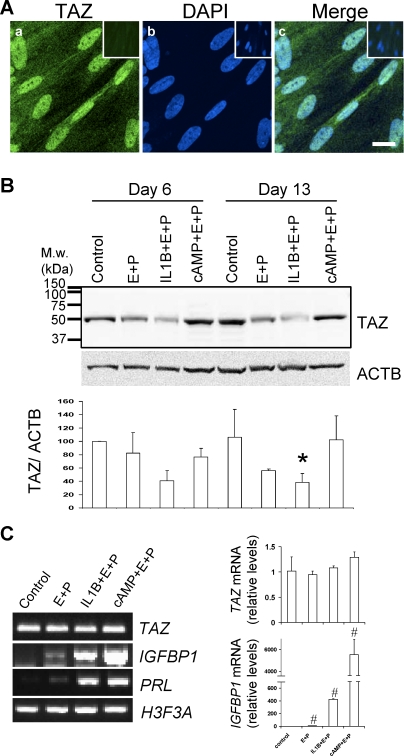
FIG. 1.
TAZ detection in HuF cells and its downregulation during in vitro decidualization. A) Confocal microscopy of immunofluorescent staining of TAZ in HuF cells (a). Nuclear staining is visualized with DAPI (b). Merge image (c). Bar = 20 μm. Nonspecific antibody control staining is in upper corner insets. B) Distribution of TAZ in total cell lysates (35 μg of protein) of HuF following decidualization for 6 days and 13 days induced by SHs (E+P), IL1B and SHs (IL-1+E+P), cAMP and SHs (cAMP+E+P), and untreated controls (control) as detected by Western blot with TAZ antibody. Membrane was reprobed with beta-actin (ACTB) antibody (blot below). Densitometric evaluation of TAZ:ACTB ratios is illustrated in graph below blots. The mean value from three experiments for the control at Day 6 was set as 100%. Note the significant difference between control and IL1B- and SH-treated cells on Day 13 (*P ≤ 0.05). C) TAZ mRNA expression during decidualization. The PCR using primers specific for TAZ, IGFBP1, PRL (prolactin), and H3F3A (histone H3.3) was performed on RNA isolated from HuF cells treated for 13 days as indicated in the figure (left). The qPCR for relative TAZ mRNA levels confirmed no change during decidualization (upper graph), although IGFBP1 mRNA was significantly different between the control and other treatments (#P ≤ 0.05, bottom graph). M.w., molecular weight; E+P, estradiol-17β and medroxyprogesterone acetate.

