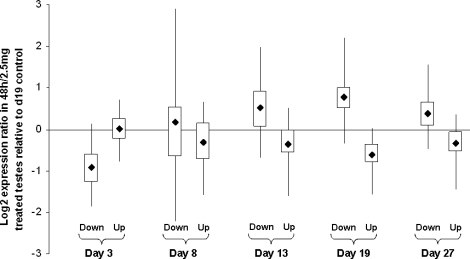
FIG. 2.
Box and whisker plots indicating the response to testosterone treatment for the genes found to be up- or down-regulated in LuRKO testes at each developmental stage. X axis: various groups of developmentally regulated genes; y axis: log2 expression ratio of the 48-h treated sample relative to untreated control. Dark square indicates the mean, boxed area indicates 50% limit, and whisker indicates 95% limit of the expression ratio for each category.

