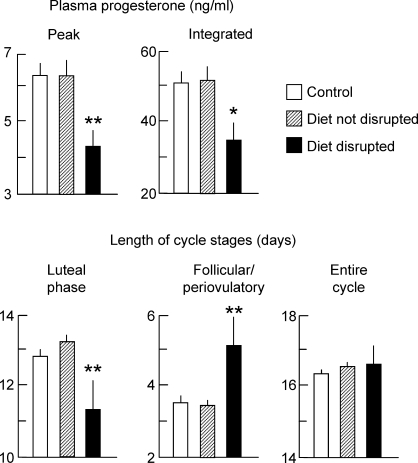
FIG. 5.
Mean estrous cycle parameters in controls (open bars; n = 8), diet-restricted animals (with or without psychosocial stress) that continued to cycle (hashed bars; n = 11), and diet-restricted animals that subsequently ceased to cycle (closed bars; n = 5) in experiment 5. Once an animal displayed disrupted cyclicity, values were excluded from the analysis (ANOVA). *P < 0.02, **P < 0.01 compared to control and diet-restricted animals that continued to have normal cycles.

