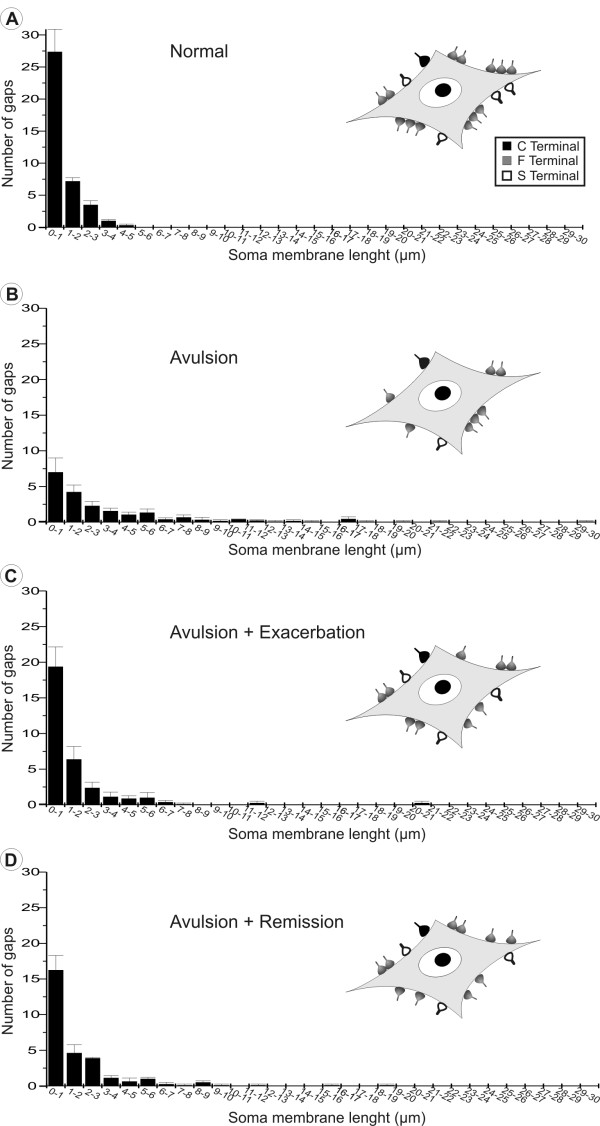
Figure 9.
Clustering of terminals on the surfaces of motoneurons after VRA and EAE induction. Distribution of gap lengths between clusters of terminals apposing motoneuron soma cell membranes. (A) Normal distribution of intervals between nerve terminals showing that boutons are organized in clusters of inputs. (B) Distribution in VRA-only animals showing alteration by extensive retraction of terminals. (C and D) Decreased presence of large gaps between terminals after the combination of EAE and VRA.

