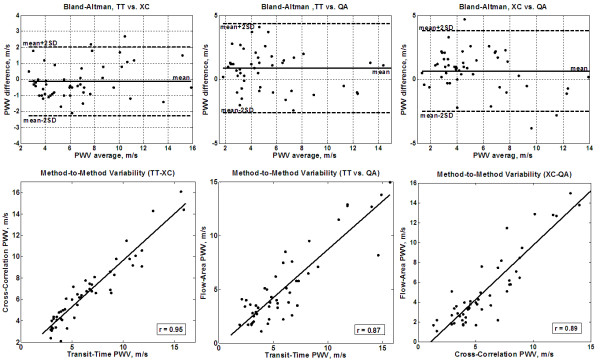
Figure 8.
Inter-method variability. Bland-Altman (up) and regression analysis (down) are shown for transit-time vs. cross-correlation (left), transit-time vs. flow-area (middle), and cross-correlation vs. flow-area (right) methods on the patients' cohort. The transit-time and cross-correlation methods have large agreement together than with the flow-area method.

