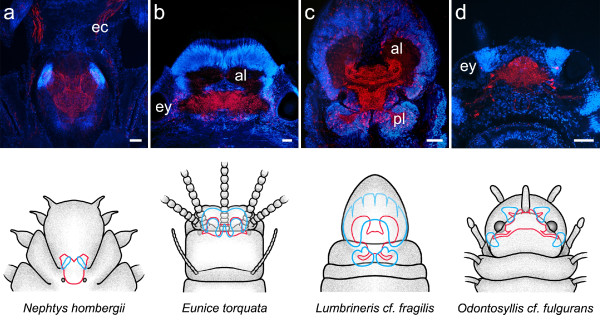
Figure 5.
Neuroanatomy of annelid representatives as revealed by a combination of immunohistochemistry (red) and cell nuclei labeling (blue). Schematic drawings depict a dorsal view of the head of the animal, with the brain outlined in red and clusters of small-diameter cells outlined in blue. Immunostainings were produced by the following antisera: anti-serotonin (a, d), anti-FMRFamide (b, c). al anterior lobe, ec circumesophageal connective, ey eye, pl posterior lobe. Scale bars: 100 μm.

