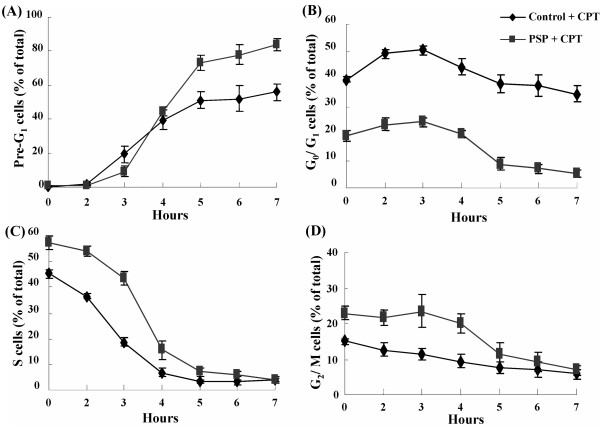
Figure 8.
DNA flow cytometric analysis of apoptotic population and changes in cell cycle distribution of HL-60 cells. HL-60 cells were pre-treated with or without PSP (25 μg/ml) for 72 hours. The cells were subsequently exposed to CPT (1 μM) for up to seven hours. A time profile of the Pre-G1 peak (A) and the changes of cell cycle distribution in G0/G1 (B), S (C) and G2/M (D) were identified and quantified with flow cytometry with PI staining. Results are expressed as means (SD) of four individual experiments analyzed with Winlist and Modfit software.

