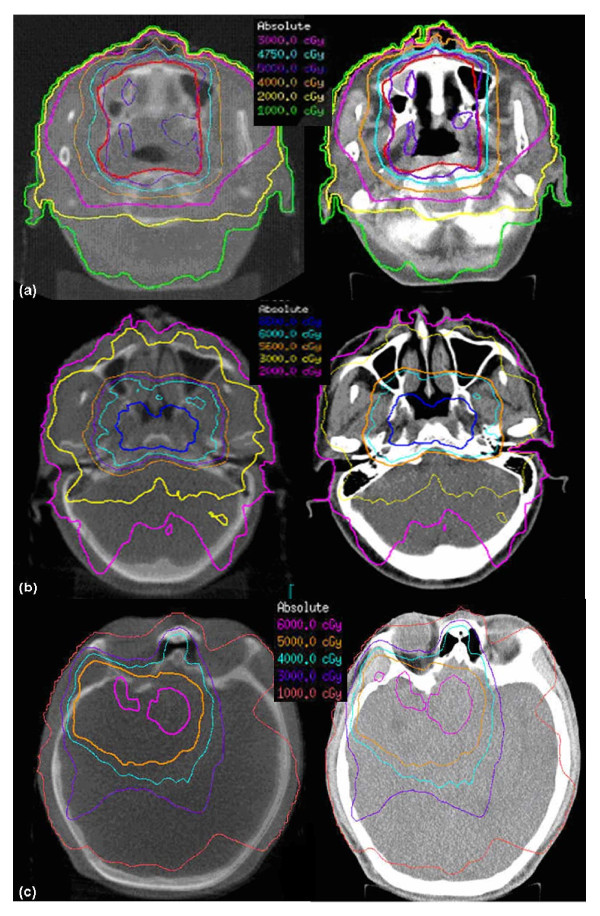
Figure 3.
Dose distributions of three clinical cases. The transverse views of dose distributions of the NK/T lymphoma (a), NPC (b) and brain tumor (c). Left: calculated dose based on CBCT images; Right: calculated dose based on planning CT images. They show good agreement on both relative high and low isodoses.

