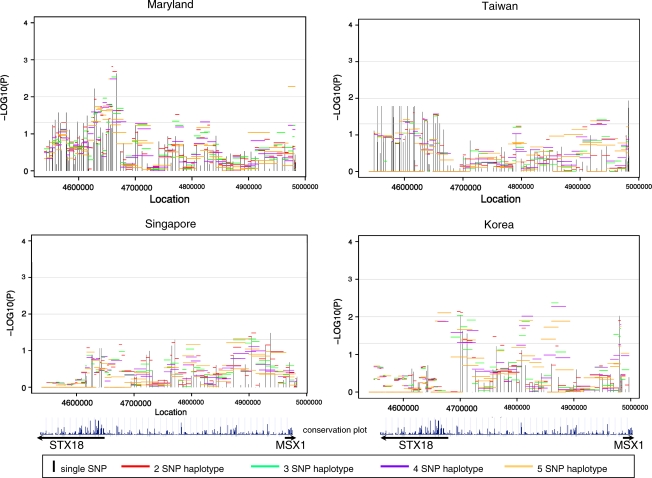
Figure 2.
Significance of individual SNPs and sliding window haplotypes in STX18 and MSX1 for CL/P trios from four populations. Vertical lines represent −log10(P-value) for individual SNPs and horizontal lines represent −log10(P-value) for haplotypes of two to five SNPs over the entire region. The conservation plot indicates percent conservation of the sequence across vertebrates, as calculated by the UCSC genome browser website29. Arrows below indicate the direction of transcription of each gene.

