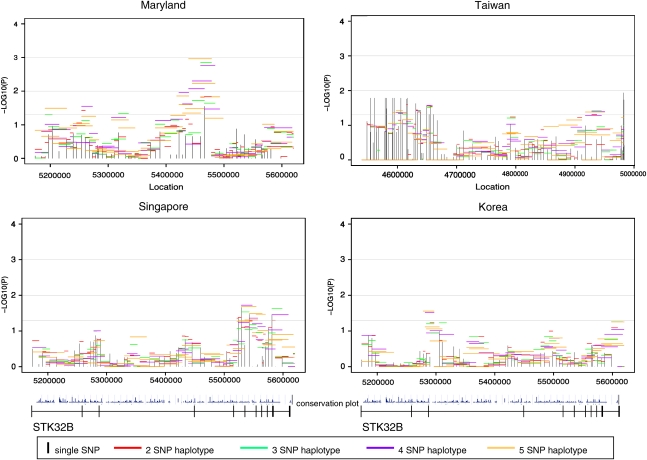
Figure 3.
Significance of individual SNPs and sliding window haplotypes in STK32B in CL/P trios from four populations. Vertical lines represent −log10(P-value) for individual SNPs and horizontal lines represent −log10(P-value) for haplotypes of two to five SNPs over the gene. The gene is transcribed from left to right in these figures. The conservation plot indicates percent conservation of the sequence across vertebrates, as calculated by the UCSC genome browser website.29 Exons are indicated by vertical lines on the line below the plots.

