
FIG 2.
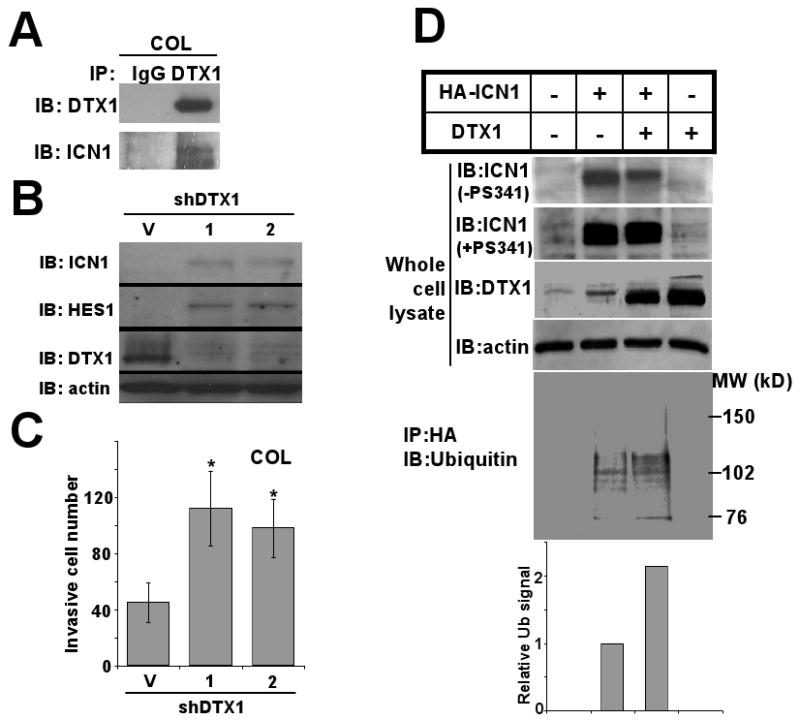
DTX1 physically interacts with ICN1 and induces ubiquitination and proteasome-mediated degradation of ICN1. (A) COL cells transduced with DTX1 or empty vector were treated with 5mM EDTA for 15 minutes to increase NOTCH1 cleavage and total ICN1 level. Immunoprecipitation (IP) of DTX1 from DTX1-transduced cells yielded both DTX1 and ICN1, as shown by immunoblot (IB). (B) Endogenous DTX1 was knocked down with either of 2 specific shRNA constructs (1) or (2); Immunoblot (IB) shows ICN1, HES1 and DTX1 protein from shRNA transduced cells compared to vector (V). (C) Histograms represent matrigel invasion of the COL cells shown in figure 1B. 1×10⁴ COL cells with DTX1 shRNAs were seeded in each transwell and invasion was quantified after 48 hours; histograms shown the mean of three wells, and error bars show standard deviation. (*, p<0.05). (D) HA-ICN1 or DTX1, alone or in combination, were transiently overexpressed in 293T cells for 48 hours. After treatment with proteasome inhibitor PS341 (0.1μM) for 6 hours or no treatment, total cell lysates were prepared. Immunoblots (IB) of ICN1, DTX1 and actin in the whole cell extracts are shown (upper panels). After immunoprecipitation of ICN1 with anti-HA beads, ubiquitination of ICN1 was measured using anti-ubiquitin antibody (lower panel). Ubiquitination level of ICN1 was quantified by densitometry (bottom panel); histograms represent relative ubiquitination level.