Fig. 6.
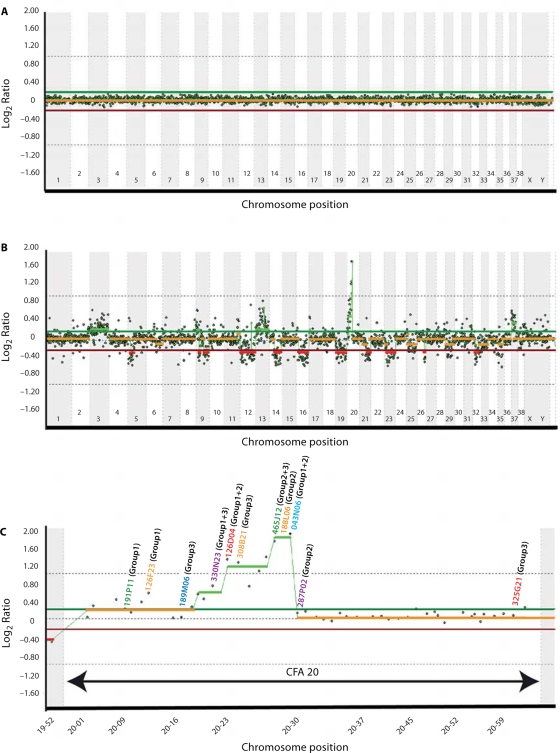
Whole genome aCGH profiles obtained using the 1 Mb assembly-integrated dog BAC array, showing composite dye-swapped array CGH profiles of (A) a self-self hybridization of differentially labeled male reference DNA and (B) a DNA sample derived from a canine histiocytic tumor co-hybridized with reference DNA. Data are plotted as the median, block-normalized and background-subtracted log2 ratio of the replicate spots for each BAC clone on the 1 Mb array. Log2 ratios representing genomic gain and loss are indicated by horizontal bars above (green line) and below (red line) the midline (orange line) representing normal copy number. The aCGH profile in A shows that the copy number status throughout the genome is reported as normal, as expected for a self-self hybridization. In B this chromosome copy-number status line appears as either red or green in regions where genomic imbalances were apparent (red = loss, green = gain), as determined by the aCGH Smooth algorithm (Jong et al., 2004). The profile indicates whole chromosome gain for CFA3, CFA13 and CFA37, and a high level amplification on CFA20. Genomic losses were detected on CFA5, CFA9, CFA12, CFA14, CFA16, CFA19, CFA21, CFA23, CFA26 and CFA32. The amplification on CFA20 is enlarged to show more detail in C, depicting the copy number ratio for all clones distributed along this chromosome. A subset of these clones (indicated on the CFA20 profile in C) was subsequently used as SLPs for FISH analysis of tumor chromosomes. The color of the text used for each clone address corresponds to the fluorochrome with which it was labeled, and the number shown against each clone address shows which clones were grouped together in FISH analysis (see Fig. 7A–E for details).

