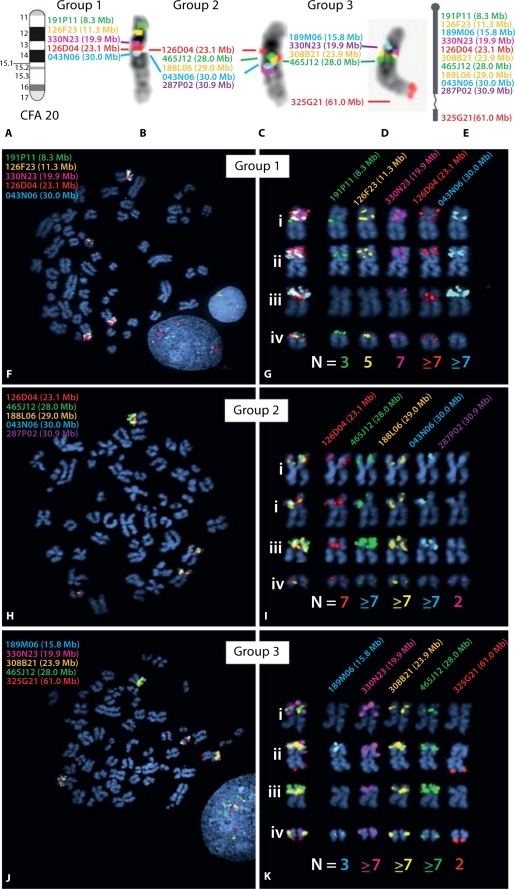
Fig. 7.
Targeted FISH analysis of CFA20 in the dog histiocytic sarcoma case, using clones from the 1 Mb array. Based on results of aCGH analysis, a panel of 11 BAC clones was selected for detailed characterization of copy number status along CFA20. Probes were combined into three groups of five differentially-labeled probes for FISH analysis (with four probes represented twice). All clones were hybridized onto normal metaphase chromosome preparations from a clinically healthy donor, to confirm the expected probe location relative to the CFA20 ideogram (Fig. 5A). The resulting images of probe signals on normal banded chromosomes are shown in B–D, and these data are summarized schematically in E. The text color corresponds to the fluorochrome with which each BAC probe was labeled, and the Mb position of each clone on CFA20 is also shown. (F–K) Results of FISH analysis using the same three groups of BAC clones on the histiocytic sarcoma case. These data demonstrate four distinct chromosome structures harboring regions corresponding to CFA20, each with a different morphology and probe hybridization profile. These four structures comprised two metacentric chromosomes, one sub-metacentric chromosome and one small acrocentric chromosome whose SLP profile was consistent with that of a grossly normal CFA20. The modal copy number for each probe in all cells analyzed is shown below the corresponding chromosome structure. Note that assessment of copy number status is challenging for probes showing high level amplifications, since apparent tandem duplications often result in large probe signals that cannot be resolved fully even in interphase preparations. Modal copy numbers are therefore based on analysis of both metaphase and interphase chromosomes from >30 cells in each instance.

