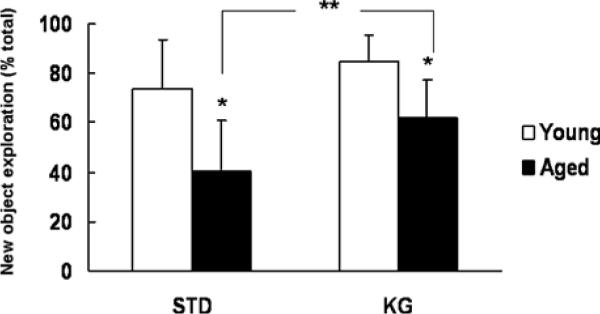
Fig. 1.

Object recognition test. New object exploration (%)=(exploration time on new object/total exploration time) × 100. Values are mean± SD, in the young, STD: n=4, KG: n=3; in the aged, n=7 each. * indicates significant difference compared to the young with same diet (t-test, p< 0.05); ** indicates significant difference between STD and KG diet groups (t-test, p < 0.05)
