FIG. 5.
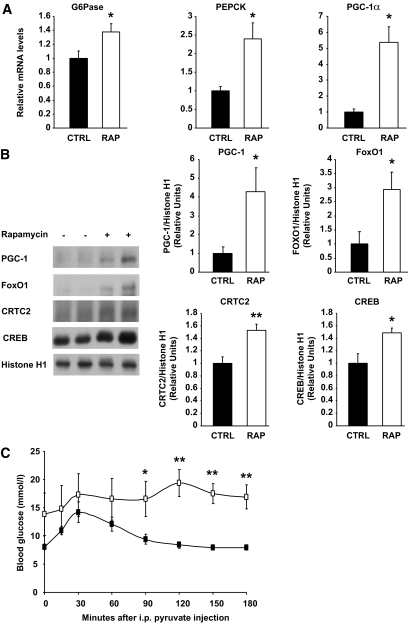
Chronic rapamycin treatment induces glucose intolerance by upregulating gluconeogenesis in rats. Rats were treated with rapamycin as described in the legend to Fig. 1. A: G6Pase, PEPCK, and PGC-1α mRNA expression. The graphs depict mRNA expression in the liver of target genes corrected for the expression of 36B4 as a control gene. B: Representative Western blots of PGC-1, FoxO1, CRTC2, and CREB proteins in nuclear extracts prepared from liver samples (two representative animals of six are shown). The graphs depict densitometric analysis of normalization of total protein/Histone H1 protein. n = 6 for each group. C: Plasma glucose levels measured during a pyruvate tolerance test on rats fasted for 12 h followed by 3 h of refeeding. n = 6 for each group. Black squares: CTRL; white squares: RAP. *P ≤ 0.05, **P ≤ 0.01.

