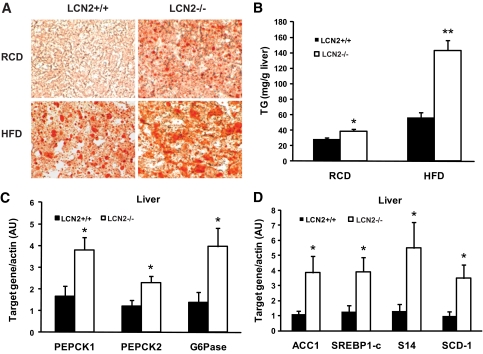
FIG. 6.
Liver triacyglyceride content in LCN2−/− mice. A: Oil-red O staining of liver section of LCN2 −/− mice. B: Liver triacyglyceride levels in LCN2−/− mice on an RCD (n = 6–8, age 30 weeks) and an HFD (n = 11, age 15–16 weeks). C: The mRNA expression of gluocneogenic genes in liver (n = 6). D: The mRNA expression of lipogenic genes in liver (n = 6). The data are represented as means ± SE. *P < 0.05; **P < 0.01. (A high-quality digital color representation of this figure is available in the online issue.)

