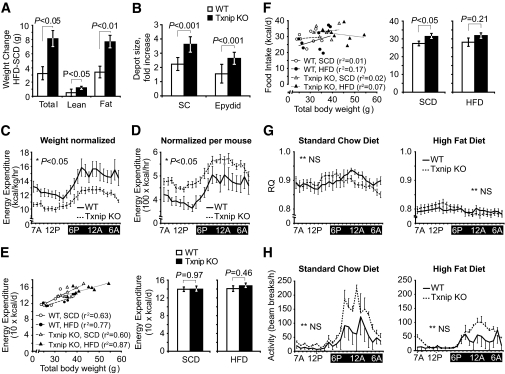
FIG. 1.
Adiposity, food consumption, metabolic rate, and physical activity in Txnip-null and wild-type control mice before and after high-fat feeding. A: Total mass, lean body mass, and total adipose weight for Txnip knockout and wild-type control mice assessed by 1H magnetic resonance spectroscopy and expressed as After HFD − Before HFD weights. n = 8 per group. B: Mean difference in weight between HFD and SCD excised fat depots. n = 6 per group. C–H: Metabolic activity measurements assessed by CLAMS. Values represent 72 h of monitoring, graphically represented with hourly values averaged to the same 24-h period. n = 8 per group: (C) Energy expenditure indexed to body mass in kilograms. D: Energy expenditure unadjusted for body mass. E, left: Energy expenditure plotted against total body mass with fitted lines of linear regression; (right) energy expenditure adjusted for body mass by ANCOVA. n = 8 per group. F, left: Average food consumption during a 60-h period plotted against total body mass with fitted lines of linear regression; (right) unadjusted comparison of mean food consumption. n = 8 per group. G: Respiratory quotient (RQ). H: Locomotor activity. *P < 0.05. **Not significant (NS) for the comparison of the mean difference between wild-type and Txnip knockout mice integrated during 72 h of monitoring. Epydid, epididymal; KO, knockout; SC, subcutaneous; WT, wild type.

