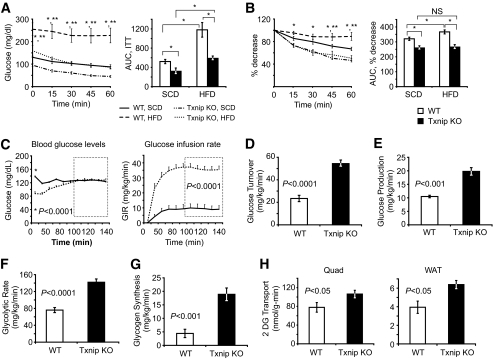
FIG. 2.
Effects of insulin stimulation on glucose utilization during hyperinsulinemic-euglycemic clamp studies after 4 weeks of HFD feeding. A and B: Intraperitoneal insulin tolerance test (ITT), 0.25 mU insulin/g body wt. A: Absolute blood glucose levels. B: Relative blood glucose levels indexed to t = 0 levels in each group. n = 6–7 per group. *P < 0.05 between HFD-fed wild-type and Txnip knockout mice, **P < 0.05 between HFD-fed wild-type and SCD-fed wild-type mice. C: Basal glucose and glucose infusion rates (GIRs) for wild-type and Txnip knockout mice during euglycemic-hyperinsulinemic clamp studies. GIR was averaged over the final 60 min of the clamp (inset box), P < 0.0001. n = 7 per group. *P < 0.0001 for basal glucose levels prior to insulin infusion. D–H: Labeled glucose precursor whole-body glucose utilization studies. D: Whole-body glucose disposal. E: Basal hepatic glucose output. F: Whole-body glycolytic rate. G: Whole-body glycogen synthesis rates. Parameters were determined by 3H-glucose infusion throughout the euglycemic-hyperinsulinemic clamp protocol. n = 7 per group for each. H: 2DG uptake into skeletal muscle (quad) and WAT. 14C-2DG was infused during the final 55 min of the 140-min euglycemic-hyperinsulinemic clamp protocol, and individual tissues were excised for scintillation counting. n = 7 per group. AUC, area under the curve.

