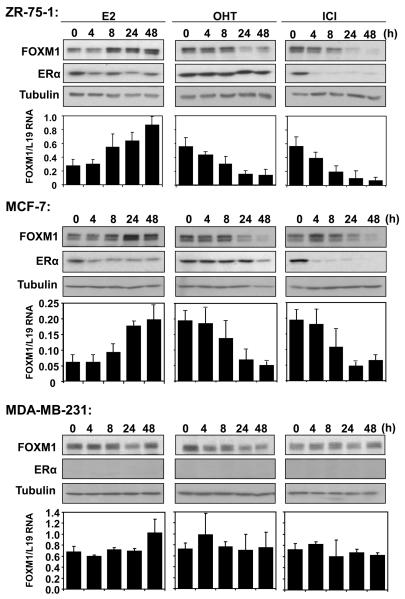
Figure 1. Expression of FOXM1 and ERα in response to E2, OHT and ICI treatments in breast cancer cell lines.
ZR-75-1, MCF-7 and MDA-MB-231 cells were cultured in 5% double-charcoal striped FCS and phenol red free medium for 24h before stimulated with E2. Breast cancer cells cultured in 10% FCS and phenol red medium were also treated with OHT or ICI. At times indicated, cells were collected and analysed for FOXM1, ERα and tubulin expression by western blotting. FOXM1 mRNA levels of these cells were also analysed by qRT-PCR,, and normalized with L19 RNA expression. Total RNA (2 μg) isolated using the RNeasy Mini kit (Qiagen, Crawley, UK) was reverse transcribed using the Superscript III reverse transcriptase and random primers (Invitrogen, Paisley, UK), and the resulting first strand cDNA was used as template in the real-time PCR. All experiments were performed in triplicate. The following gene-specific primer pairs were designed using the ABI Primer Express software: FOXM1-sense: 5′-TGCAGCTAGGGATGTGAATCTTC-3′ and FOXM1-antisense: 5′-GGAGCCCAGTCCATCAGAACT-3′; ERα-sense: 5′-CAGATGGTCAGTGCCTTGTTGG-3′ and ERα-antisense: 5′-CCAAGAGCAAGTTAGGAGCAAACAG-3′; L19-sense 5′-GCGGAAGGGTACAGCCAAT-3′ and L19-antisense 5′-GCAGCCGGCGCAAA-3′. Specificity of each primer was determined using NCBI BLAST module. Real time PCR was performed with ABI PRISM 7700 Sequence Detection System using SYBR Green Mastermix (Applied Biosystems, Brackley, UK). The qRT-PCR results shown are representative of 3 independent experiments.

