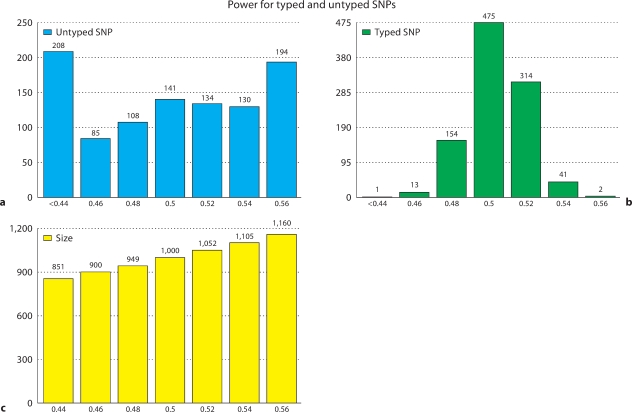
Fig. 4.
Histograms of power for 1000 simulations of case control studies where the causal SNP is typed (b) or untyped (a). Simulated case control studies were generated by sampling from 120 chromosomes to achieve 1000 cases and 1000 controls. The estimated minor allele frequency of the SNPs were 0.1 and the estimated r2 between the typed and untyped SNPs was 0.8. Each of the 1000 power estimates is calculated from 1000 simulated case control studies. The relative risk is chosen such that the simulations at typed and untyped SNPs both have an expected 50% power. The error in power estimation is much higher for the untyped case and leads to severe over and under estimation problems. A histogram of the number of individuals to needed achieve power between 44 and 56% in the untyped simulation is included for reference (c).

