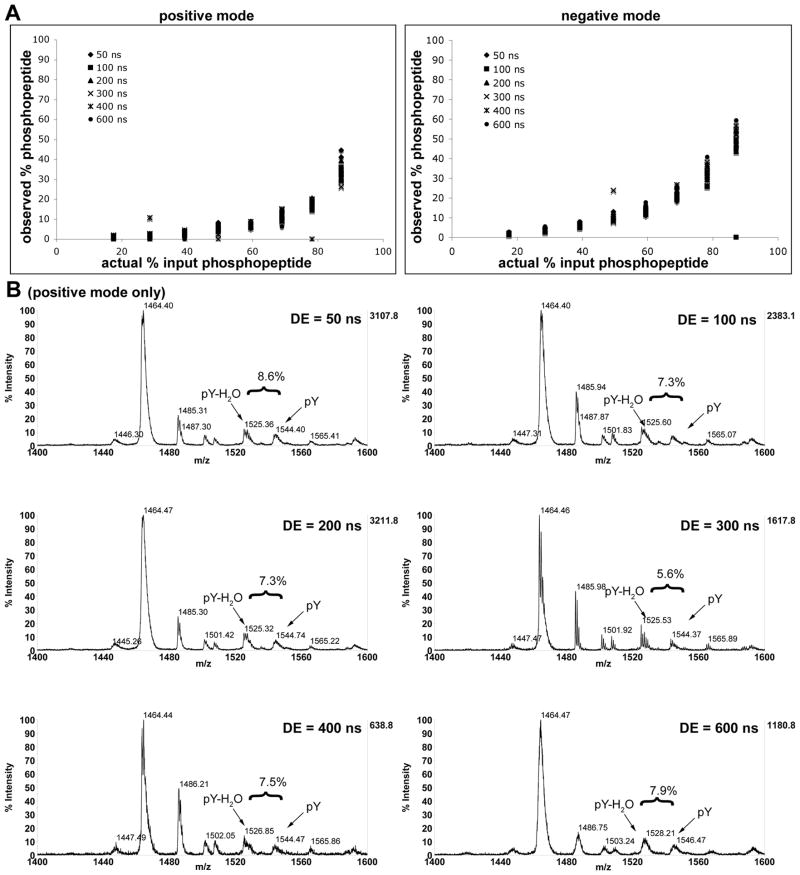
Fig. 2.
Analysis of the effect of delayed extraction times on relative signal intensity for peptide 6 (TSTEPQ(p)YQPGENL). a) data for positive and negative modes plotted for each extraction time; b) Representative spectra for positive mode at phosphopeptide (m/z = 1544) input concentration of 59.4%. While resolution changes with different extraction times, observed relative intensity does not. For additional data in negative mode, see supporting information.

