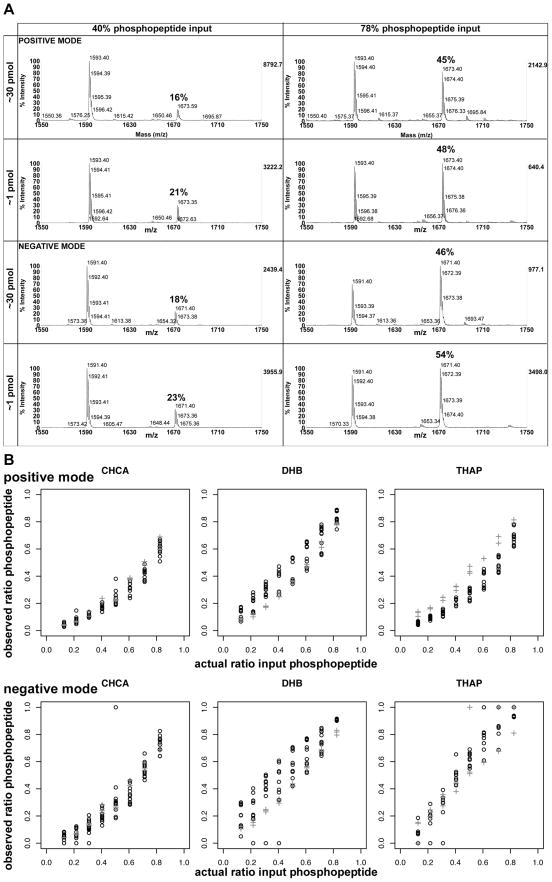
Fig. 3.
a) Representative spectra for comparison of analysis at ~30 pmol/spot vs. ~1 pmol/spot for peptide 4 (RRLIEDNE(p)YTARG) at phosphopeptide inputs of 40% and 78% spotted with CHCA matrix. b) Variation in the observed phosphopeptide signals at the different concentrations falls within typical variance of the measurements: 30 pmol = black open circles; 1 pmol = grey hatches.

