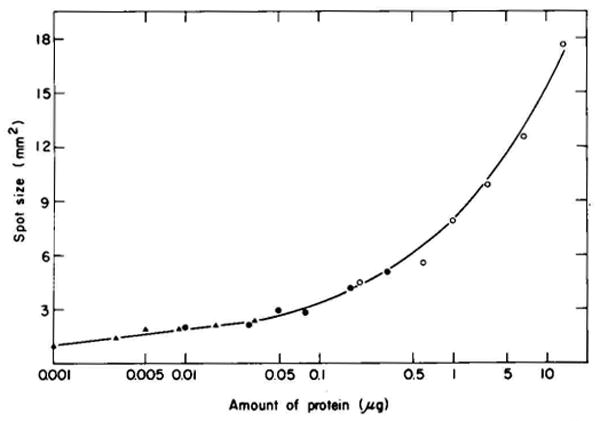
Fig. 4.

The effect of the amount of protein on spot size. The data were obtained from an analysis of six gels containing known amounts of Escherichia coli protein. Four of the gels used are shown in Fig. 5. The area of each spot and the amount of protein in each spot were determined as described under “Materials and Methods.” A different symbol is used to record the data collected for different spots. The coordinates given refer to Fig. 5A; ○ = 8.8 × 3.4, ● = 9.5 × 3.1, ▲ = 7.0 × 3.3. The size of these spots was measured from autoradiograms of much lower exposure than those shown in Fig. 5. Low exposure autoradiograms were used to avoid possible increases in spot size due to overexposure of the film.
