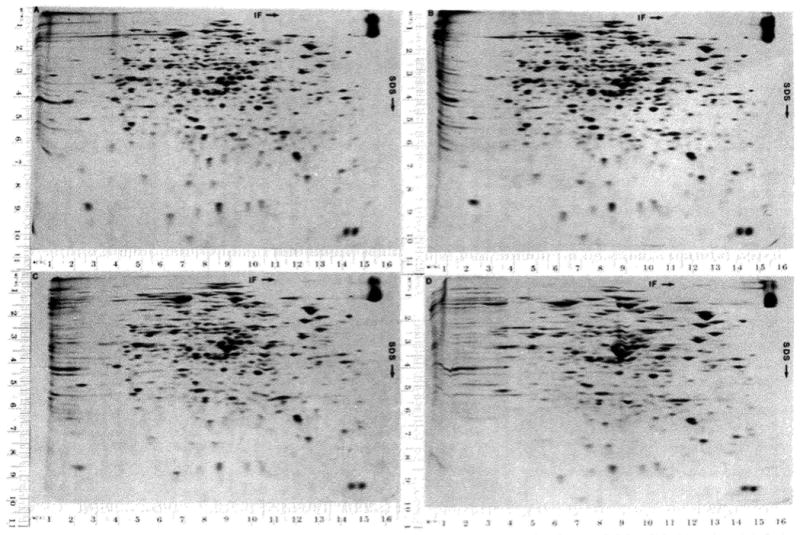
Fig. 5.

Effect of increasing the amount of protein on the resolution is illustrated by the four two-dimensional separations shown. In all cases 350,000 cpm in 4μ g of 14C-labeled Escherichia coli protein were loaded on the gel. In addition, 3, 16, 32, and 128 μg of unlabeled E. coli protein were loaded on Gels A, B, C, and D, respectively. These preparations of E. coli protein were not treated with RNase and DNase. The slab gel is a uniform gel of 12.5% acrylamide. The autoradiograms illustrated were exposed for 72 hours.
