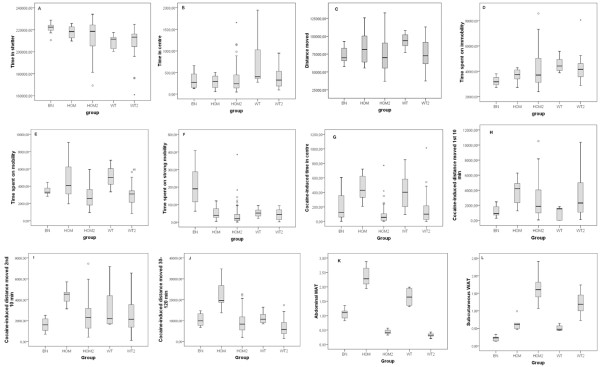
Figure 1.
Phenotype ranges for traits recorded in the 3-day Phenotyper test, the cocaine-induced locomotor test, and for WAT traits. Solid boxes represent the 50% of trait values closest to the median (bold line). The dashed lines represent the low and high 25% of trait values. Genotypes: BN = parental BN; HOM = parental SERT-/-; HOM2 = F2 SERT-/-; WT = parental SERT+/+; WT2 = F2 SERT+/+

