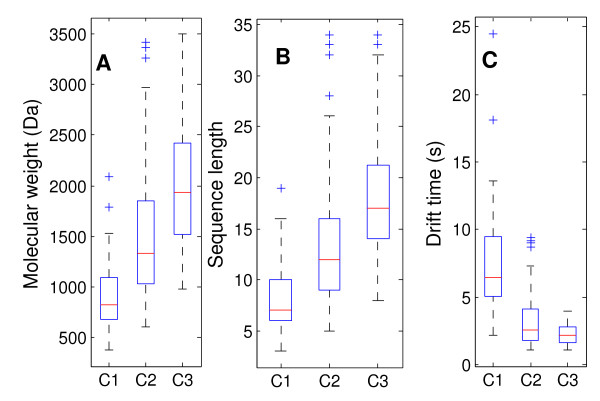
Figure 1.
Box plots of peptide molecular weight (A), sequence length (B) and drift time distribution (C) in the three datasets. The central mark is the median, the edges of the box are the 25th and 75th percentiles, the whiskers extend to the most extreme data points that are not outliers, the cross points are outliers if they are larger than Q3+1.5*(Q3-Q1) or smaller than Q1-1.5*(Q3-Q1), where Q1 and Q3 are the 25th and 75th percentiles, respectively.

